Our work
Analytics
Dashboards
Dashboards on the data the company already has
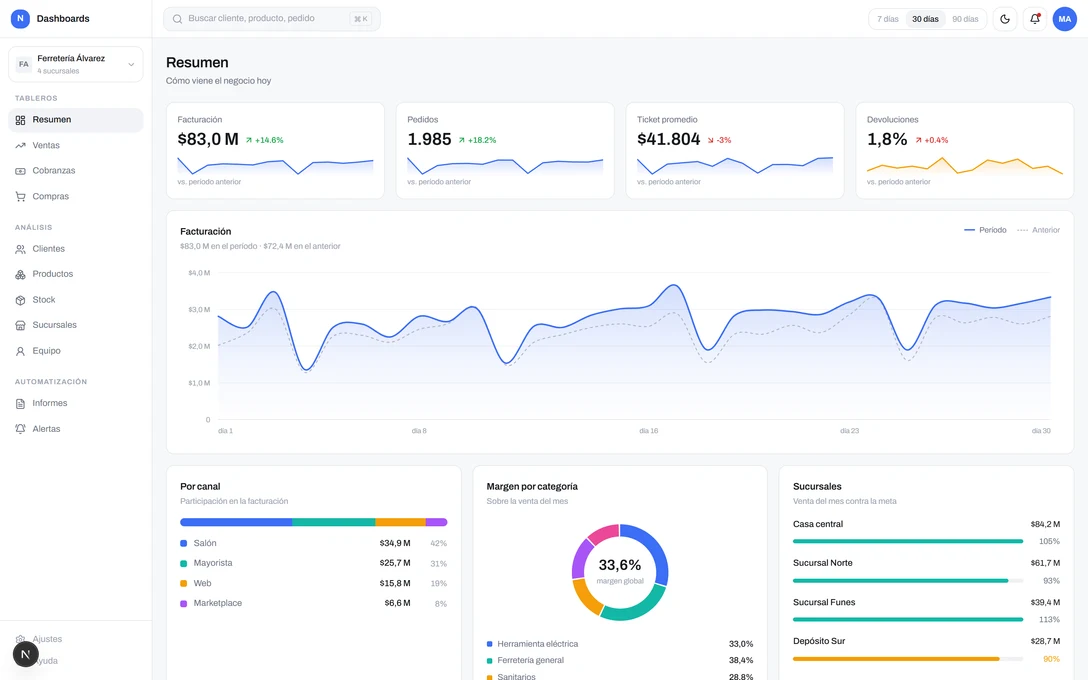
The demo is a recreation of the system, with made-up data: the original belongs to the client and is not published. No sign-up needed.
The context
Companies that already have the data —in an ERP, in a database, in spreadsheets— and nowhere to look at it without asking someone for an export and waiting. The first dashboard always gets looked at; the one that survives the month is the one that also speaks up on its own.
What the system does
- Eleven dashboards by area: summary, sales, collections, purchasing, customers, products, stock, branches and team
- Charts that each answer one question: retention cohorts, margin waterfall, heat map by hour and day, volume against margin scatter
- The date range recalculates everything, including the comparison against the previous period
- Reports that generate and send themselves, and rule-based alerts to each area's channel
- Read-only connection to the system in use, with per-table frequency and access by role
- Light and dark theme: people look at this eight hours a day and they have opinions