Our work
Agriculture
FieldSight
The field seen from above, and the application order that comes out of it
The demo is a recreation of the system, with made-up data: the original belongs to the client and is not published. No sign-up needed.
The context
Satellite imagery of a farm reached growers a long time ago: there are half a dozen platforms that show it in color. The problem is that's where it ends. The agronomist looks at a nice map, says «this corner is coming in weak», and then goes out and applies the same fertilizer rate across all hundred acres, because turning that map into a prescription the planter can read is a separate job almost nobody does. The image isn't the product: the product is the application order.
What the system does
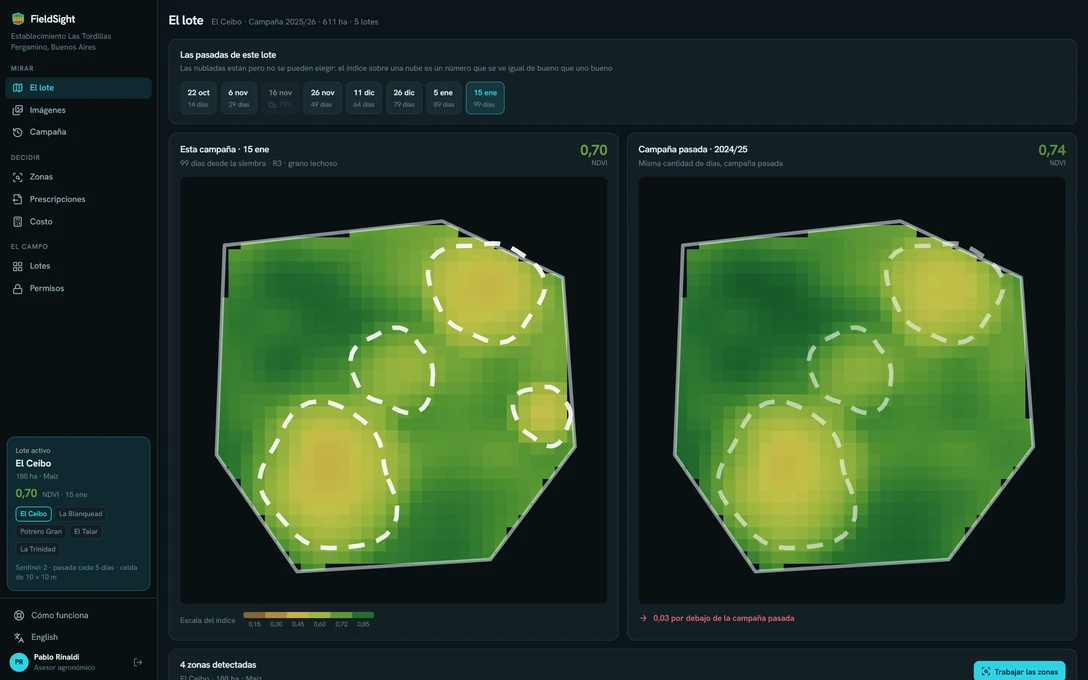
- The field is seen against itself: today's image next to the same date last season, because a vegetation index with nothing to compare it to doesn't say whether things are good or bad, it says a number
- Low-vigor zones flag themselves and each one has a button that turns it into a prescription. It's the one step that separates a viewer from a system, and it's the one no platform takes
- Zoning splits the field into three management zones and shows how many acres fall in each one, because the decision isn't «there's a patch»: it's how much extra urea to buy
- Cloudy images are discarded and it says which ones: an index calculated over a cloud is a false reading that looks exactly like a good one
- The prescription exports in the format the planter controller reads and is saved with its date, so next season you can look back at what was applied and what it yielded
- The field's history is by season and not by file: what was planted, what was applied and how it looked from above, on a single timeline
- And the cost of the prescription sits next to the map. Variable rate almost always costs more in inputs and less in total; if the system doesn't show both halves, the argument comes down to faith